

Nuts&Bolts: What would proportional representation look like in the United States?
Nuts&Bolts: What would proportional representation look like in the United States?
A picture is worth a thousand words. Multi-winner district maps show the potential


As social media becomes more ubiquitous, the world has gotten smaller. Americans are able to see politics beyond their borders more easily. As a consequence, more Americans are learning that the way we conduct elections, and the political problems that attend them, is out of step with the rest of the world. Most modern democracies operate quite differently from the United States. Few have separately elected independent executives like our President; some do not even use written Constitutions; and most elect their legislative bodies with proportional representation instead of our single-seat district, winner-take-all method.
Proportional representation, at its simplest, means that a share of the votes elects an equal share of the seats. If a political party earns 40% support nationwide, then it should hold 40% of the seats in the national assembly; if a smaller party wins 15% of the vote, it should elect 15% of the seats. Applying this principle to elections carries many benefits: Countries with proportional representation are free of gerrymandering, every election is competitive, more perspectives are represented, racial and ethnic diversity is better represented, women and youth have higher levels of representation, and on and on. Countries with proportional representation even had a better response to the Covid-19 pandemic than those with winner-take-all, because bringing all viewpoints to the table tends to result in having better health infrastructure.
Can we adopt proportional representation in the United States? In fact, we are closer to it than many realize. We have a history of proportional representation - with cities like Cincinnati and even New York City experimenting with proportional elections early in the 20th century. It has momentum today: Albany, California adopted it in 2020 with 73% voting in favor, and a charter commission in Portland, Oregon unanimously recommended it for their city.
There is a bill for proportional representation for Congress as well - The Fair Representation Act, H.R. 3863, introduced by Rep. Don Beyer of Virginia. That bill would implement the same form of proportional representation used by the cities listed above: proportional ranked choice voting. The smaller states would elect all representatives statewide - no need for the painful process of redistricting - while larger states would divide into a few regions that each elect three, four, or five representatives.
This is essentially the form of proportional representation used by both Ireland and Northern Ireland. Northern Ireland held elections in May, 2022, and the map of election results tells much of the story of how it works:

Each district elects several winners, not just one. And because the version of ranked choice voting that Northern Ireland uses is proportional, several parties can be represented in every district. Notice that nearly all the parts of the country that are colored green - places where the left-of-center Sinn Féin party leads - have at least one seat won by the right-of-center Democratic Unionist Party (the orange dots). And in many of the regions where the DUP leads, Sinn Féin has won a seat. Representation is not so polarized by having safe seats and even safe states for one political party, like it is in the US.
If the Fair Representation Act passes, congressional election results will look more like this. No more red and blue districts, but representation of Republicans and Democrats in fair proportion to their support everywhere. In fact, it is possible to use a model like Ireland’s results to demonstrate what a system like that could look like in the US.
The maps of Our Shared Republic
In March, 2021, I began using Dave’s Redistricting App, a powerful (and free!) online tool for drawing districts, to simulate the Fair Representation Act. Over the rest of 2021, I worked with friends in the electoral reform space to draw a sample multi-winner district map for every state. To make it more fun, we even livestreamed our sessions on Twitch.com, all while informally chatting and answering questions in the comments.
We can do this, because the Fair Representation Act is remarkably specific about how such districts should be drawn. It says to follow a few simple rules:
If a state elects five or fewer members total, elect all statewide without any districts;
For larger states with six or more members, divide into districts that elect at least 3 winners and no more than 5 winners, with an equal number of people per representative in each district;
Districts must comply with the Voting Rights Act and not be drawn in a way that dilutes the voting power of racial or ethnic minority communities;
No district should favor one political party to such an extent that they would be expected to win every seat;
Use as few four-winner districts as mathematically possible;
Use as many five-winner districts as possible; and
Keep communities of interest together.
These rules go in order of priority. For example, if a state elects nine representatives total, you should draw three districts that each elect three representatives, for nine total. You could instead draw two districts that elect five and four representatives, but because you must have as few four-winner districts as possible, you normally won’t do that.
Within each district, we can also make a projection for how the election would go, using the same sorts of data we use to assess today’s districts. Under today’s districts, if President Biden won in a district by, say, eight more points than his national average, we’d call that a D+8 district, probably safe for Democrats. On the other hand, if a three-winner district is also D+8, we would expect voters to elect two Democrats and one Republican. In practice, it might be more complicated than that, with new voices participating and more viewpoints winning seats, but voters who preferred Biden to Trump would have the power to elect two seats, and voters who preferred Trump to Biden would have the power to elect one.
With that information, we can literally map the Fair Representation Act onto every state, and the results are remarkable. The sinuous squiggles of today’s gerrymanders dissolve into a smaller number of shared communities within each multi-winner district, each reflecting the diversity of its populations.

As this map of Illinois shows, switching to proportional ranked choice voting will have a partisan impact in some states, undoing both intentional gerrymandering as well as the natural partisan skews based on geography found in states with urban-rural polarization. With multi-winner districts, downstate Democrats in Illinois earn representation even if they do not live in one of its pockets of urbanism, and Republicans in Chicago would finally have a voice in Congress.
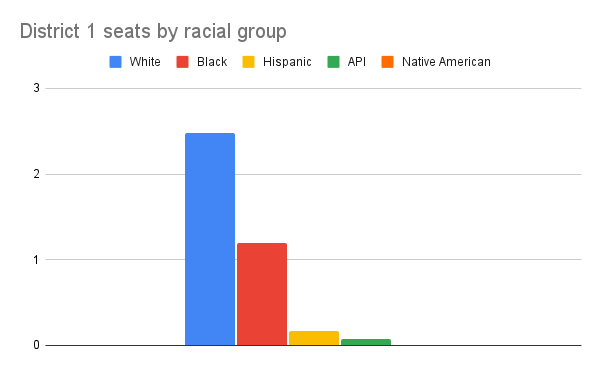
We can assess the likely racial impact of the Fair Representation Act in a similar way. Places with racially polarized voting rely on districts where communities of color have the numbers to elect a candidate of choice. With single-winner districts, that is often a majority of the district, but with multi-winner districts, it would take far less. If more than 25 percent of the voting age population in a three-winner district is Black, say, that is the equivalent of one majority-Black district. This alone opens up many majority-white regions with significant populations of Black, Latino, and API voters to actual, multi-racial representation.
For an example, consider Louisiana. The state has only one majority-Black district out of six seats, a jagged corridor including most of New Orleans and several majority-Black neighborhoods to its west. This arrangement leaves two-thirds of Louisiana’s Black population spread among its five other districts, each majority white and safe Republican. Voting rights advocates have sued, arguing that it violates the Voting Rights Act by diluting the Black vote in Louisiana. But recently the Supreme Court reversed a lower federal court’s decision striking a similar map in Alabama, signaling its clear intent to effectively end race-conscious districting under the Voting Rights Act.
Under the Fair Representation Act, Louisiana would divide into two districts. The map shown here simply divides the state into two equal population districts by following the Mississippi River and county boundaries. The two graphs below show the demographics of these two districts - with Black voters solidly over the threshold for a seat in each of them. Under a map like this, every voter would have genuine representation, whether they are white or Black; Democrat or Republican; urban or rural.

I have published maps like these for every state that elects six or more representatives, along with analysis of those that would elect five or fewer statewide (no need to draw a map for those, of course). You can view an index linking to every one of them here, or see them listed at the end of this article.
As I developed these, I put them all into a big Twitter thread along with 26 facts about the Fair Representation Act, where you can see how the visualization has evolved. Since then, I have reformatted them all to make them as easy to see and understand as possible. I even did alternative versions for two states: New Jersey and California.
You can browse them all yourself. Find your state. Take a look at the image of the map, and compare it to its associated data and analysis sheet. Each sheet gives the overall partisan projection, as well as the projection for each district. A separate tab shows the racial demographics of each district. Finally, if you have an account over at Dave’s Redistricting App, you can view the maps and data there in more detail, or even make a copy of one and adjust the lines yourself.
These maps teach us a few basic facts about the impact of the Fair Representation Act:
Both Republicans and Democrats would be competitive in every single district across every single map, and in every part of the United States. However “red” or “blue” a region is, that region has voters who like Democrats and voters who like Republicans, and all of those voters would have real representation. No more “orphaned voters” without an electoral home.
Communities of color would have far more electoral power. Under these maps, Black voters would have the power to elect at least one candidate in every district in Louisiana, Mississippi, Alabama, Georgia, South Carolina, and North Carolina. Latino voters would have the power to elect at least one candidate in every district in Texas, New Mexico, Arizona, Nevada, and California. API voters would be over the threshold for 10 seats, and closer to the threshold for a seat than any other group for another seven seats.
Nationally, either major party could expect to win a majority of the House in a year that favored that party overall; there would be no significant partisan skew in any state, or years where a party winning a majority of the popular vote ends up with a minority of seats.
These are demonstrations. If the Fair Representation Act passes, the actual maps will be adopted by independent commissions tasked with following the guidelines listed earlier in this article.
We do not have to accept the winner-take-all rules presently imposed on states. Proportional representation would give us the tools to address our most intractable political problems; it would provide fair representation to voters; and it could even reverse the trend of ugly negative winner-take-all partisanship that threatens the future of the republic itself. With the Fair Representation Act, we can do that without a constitutional amendment, and with a system that retains a direct link between voters and their representatives, retains local representation, and has a track record of success in our local elections.
Drew Penrose @RepublicShared
Drew Penrose is an elections policy expert and consultant based in Maryland.
Maps and associated files — overall index
National
Alabama
Alaska
Data & analysis (all small states)
Arizona
Arkansas
Data & analysis (all small states)
California - Option 1
California - Option 2
Colorado
Florida
Georgia
Hawaii
Data & analysis (all small states)
Idaho
Data & analysis (all small states)
Illinois
Indiana
Iowa
Data & analysis (all small states)
Kansas
Data & analysis (all small states)
Kentucky
Louisiana
Maine
Data & analysis (all small states)
Maryland
Massachusetts
Michigan
Minnesota
Mississippi
Data & analysis (all small states)
Missouri
Montana
Data & analysis (all small states)
Nebraska
Data & analysis (all small states)
Nevada
Data & analysis (all small states)
New Hampshire
Data & analysis (all small states)
New Jersey - Option 1
New Jersey - Option 2
New Mexico
Data & analysis (all small states)
New York
North Carolina
North Dakota
Data & analysis (all small states)
Ohio
Oklahoma
Data & analysis (all small states)
Oregon
Pennsylvania
Rhode Island
Data & analysis (all small states)
South Carolina
South Dakota
Data & analysis (all small states)
Tennessee
Texas
Utah
Data & analysis (all small states)
Vermont
Data & analysis (all small states)
Virginia
Washington
West Virginia
Data & analysis (all small states)
Wisconsin
Wyoming
Unfortunately while 5 member districts may better balance Ds and Rs it will likely take 10 member districts to give thirds parties an initial seat at the table. Ten percent should be enough to get representation.